
Read our white paper to learn more
SHM™ is our patented measure of traffic hazard. Grounded in physics and traffic kinematics, SHM™ provides objective, assumption-free measurements of collision risk—no predictions, just quantifiable truth. SHM™ is based on two main parameters:
Proximity (separation distance)
Motion (relative speed)
Our software uses movement data (or tracks) and computes the hazard posed between all pairs of traffic actors in a scene. As with a thermometer continuously measuring temperature, SHM™ is a continuous measure of collision hazard.
Leading
Quantitative
Free of Assumptions
Continuous
Independent
Repeatable
Monotonic
Objective
Computable
Scalable
There are many other traffic safety measures in the industry, but none deliver all these simultaneously—only SHM™ provides this comprehensive approach.
Collision-based statistics require billions of miles to achieve 95% confidence—making them impractical for timely safety decisions.
The infrequency of collisions and the many contributing factors beyond driver decision-making render historical collision statistics of limited use for judging whether a driver (automated or human) is sufficiently safe to drive, particularly in congested, complex traffic conditions.
The use of IMU data, drawn from cell phone or dashcam accelerometers and gyroscopes, relies on the assumption that rapid decelerations — such as harsh braking and turning — are associated with risky driving behaviors.
Despite high volume and low cost, IMU data show weak correlation with actual collision risk—limiting their effectiveness for safety prediction

Unlike traditional approaches, we measure interactions. We transform kinematic interactions into quantified near-miss severity scores—proven predictors of incident likelihood and severity (as demonstrated in areas such as civil aviation and the chemical process industry).
Our software processes movement data from multiple sources—dashcams, traffic cameras, or sophisticated perception layers—transforming it into actionable safety intelligence for your business.


Dashcam video
Traffic camera video
Perception Layer object data

Cloud native
Colocated in client’s region
Secure segregation of data

Automated KPIs
Training data
Safety Case evidence
Our software automatically classifies each pairwise traffic interaction each tick of the sensor clock, creating a unified typology of interactions similar to other classifications created by NHTSA and SAE.
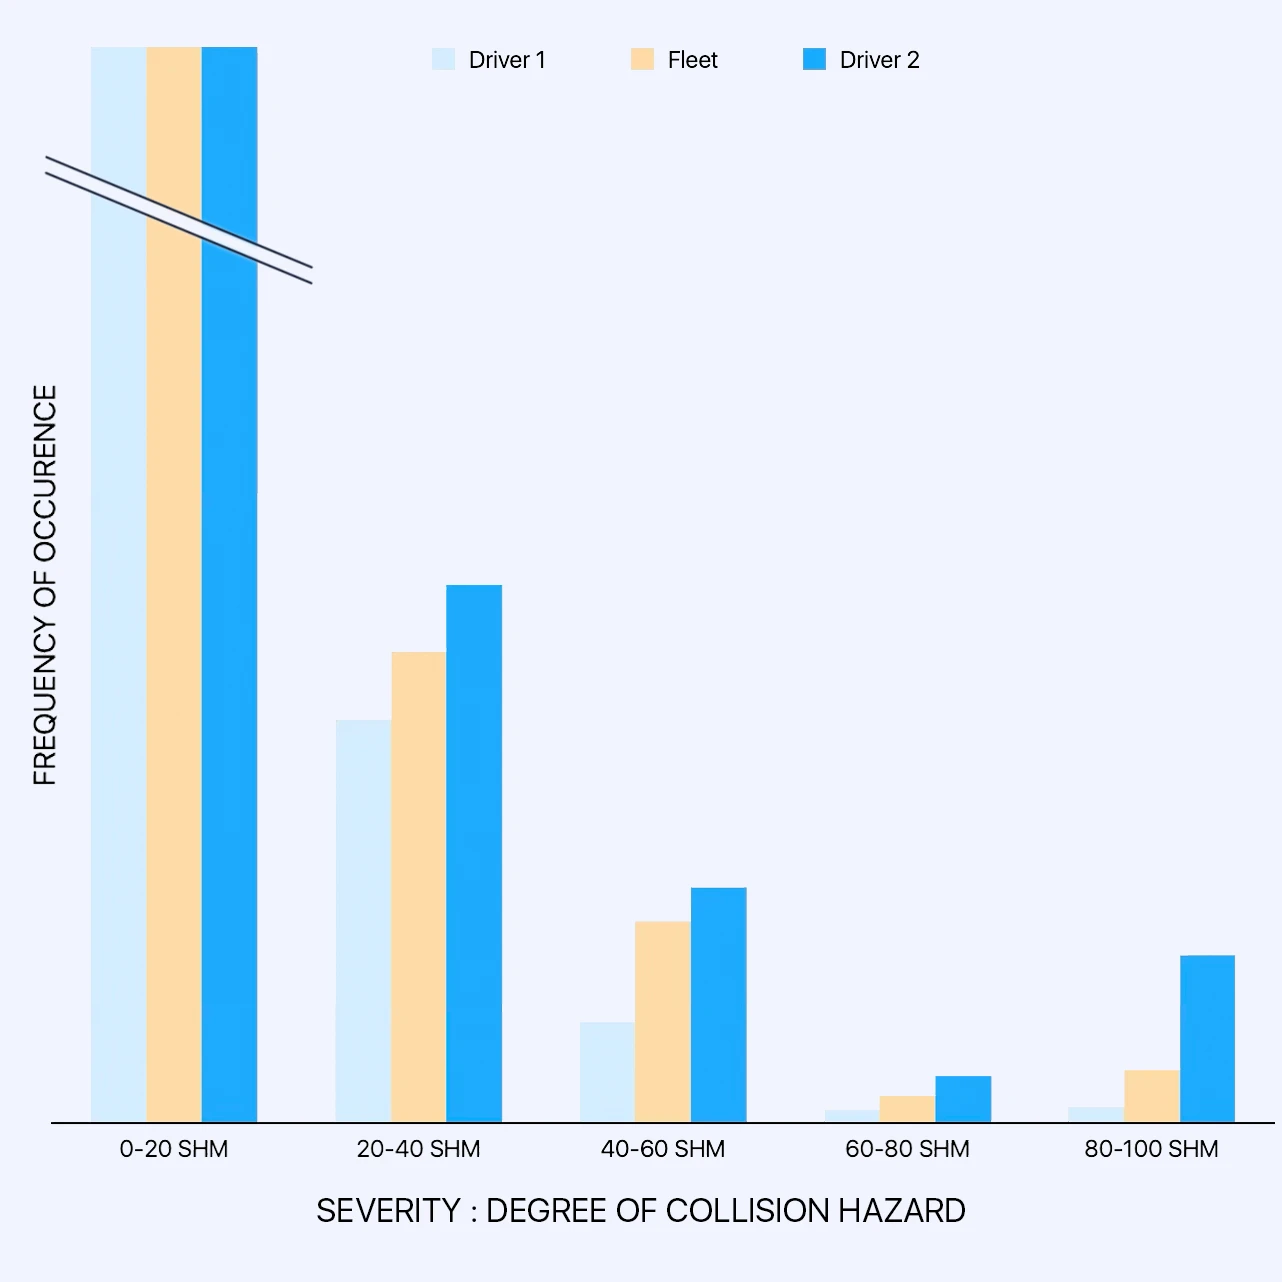
Conceptually, a higher SHM™ value correlates with a higher degree of collision hazard, allowing easy comparisons amongst drivers or routes.
The more time a driver spends in the most hazardous bin (SHM 80-100), the higher likelihood of collision.
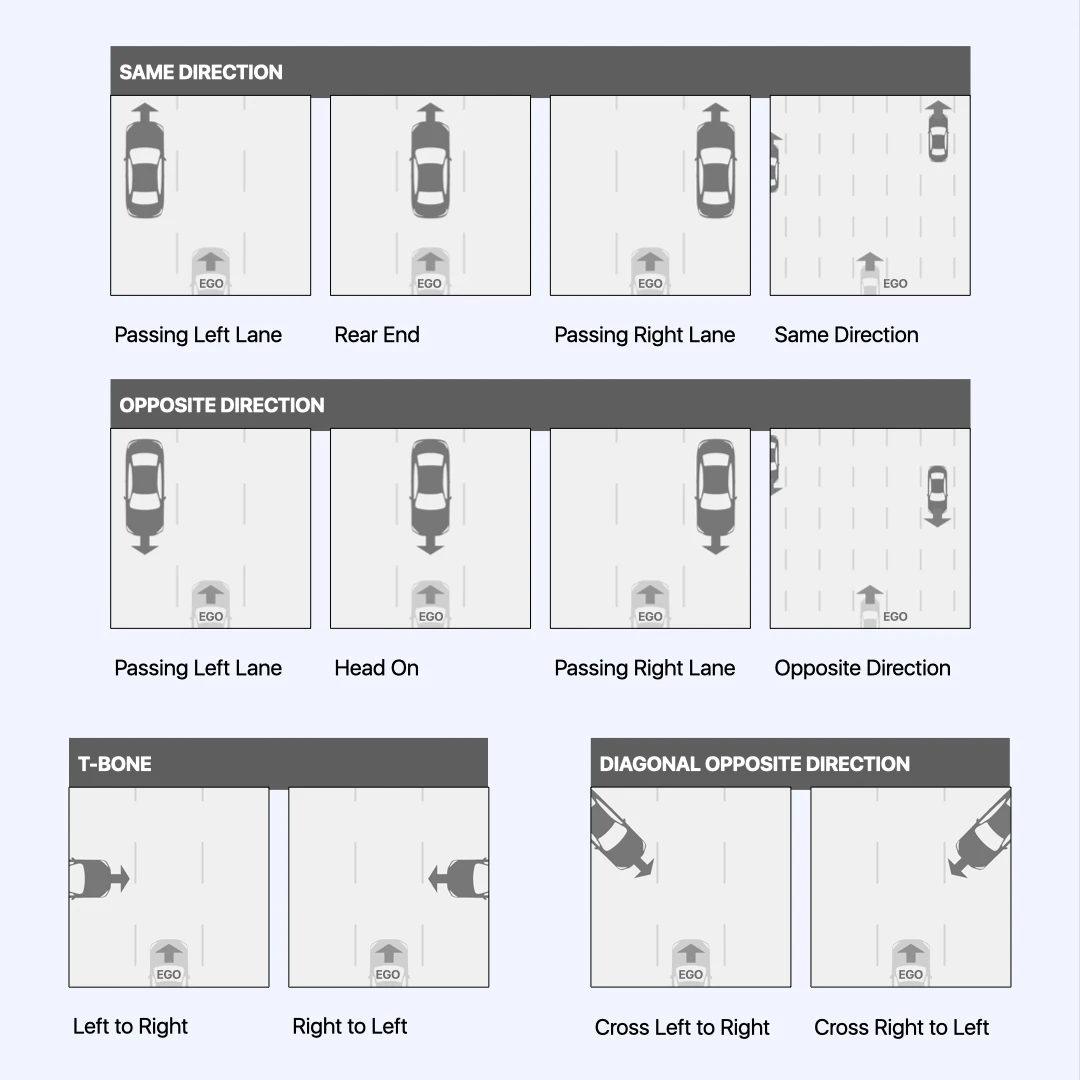
As a consequence of calculating the object tracks, the platform also automatically aggregates the type of interactions between the ego and all other objects.
This novel aggregation, when combined with the severity of each interaction, opens up new possibilities of understanding how and why specific hazards occur.
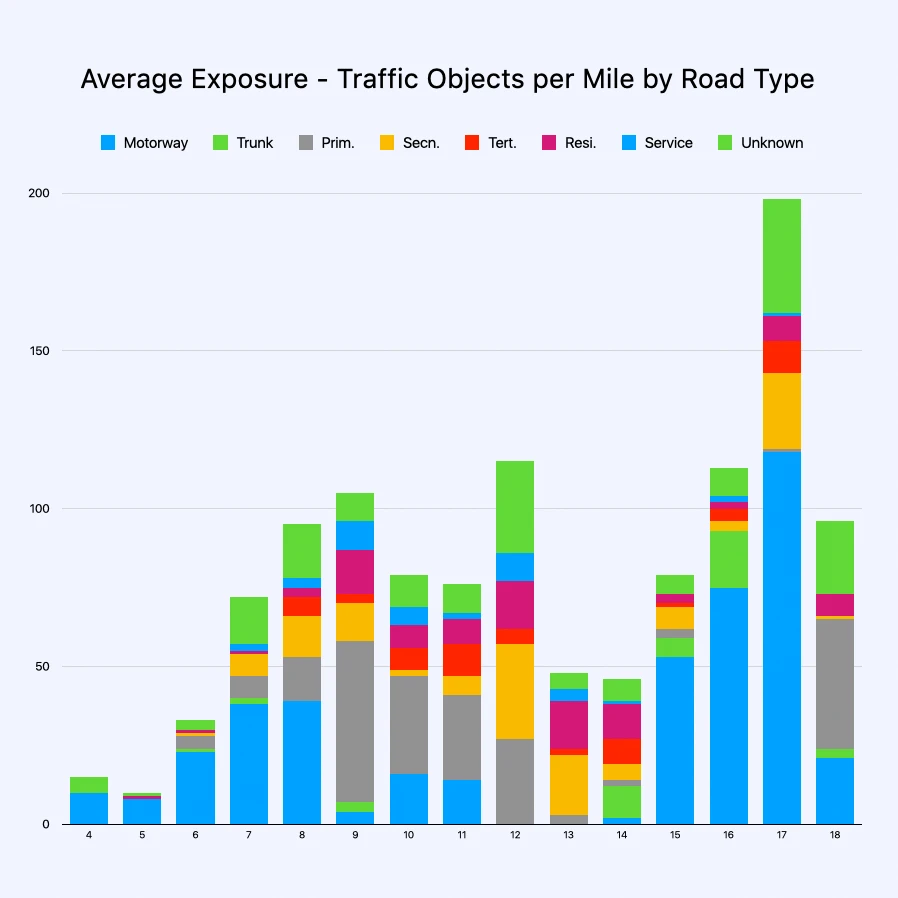
SHM™ data aggregates by driving circumstances and/or scenarios as the most effective indicator of risk.
Driving Circumstance / Scenario Factors:
- Time of Day
- Roadway Type
- Traffic Object Pair Type
- Traffic Object Interaction (TOI) Type
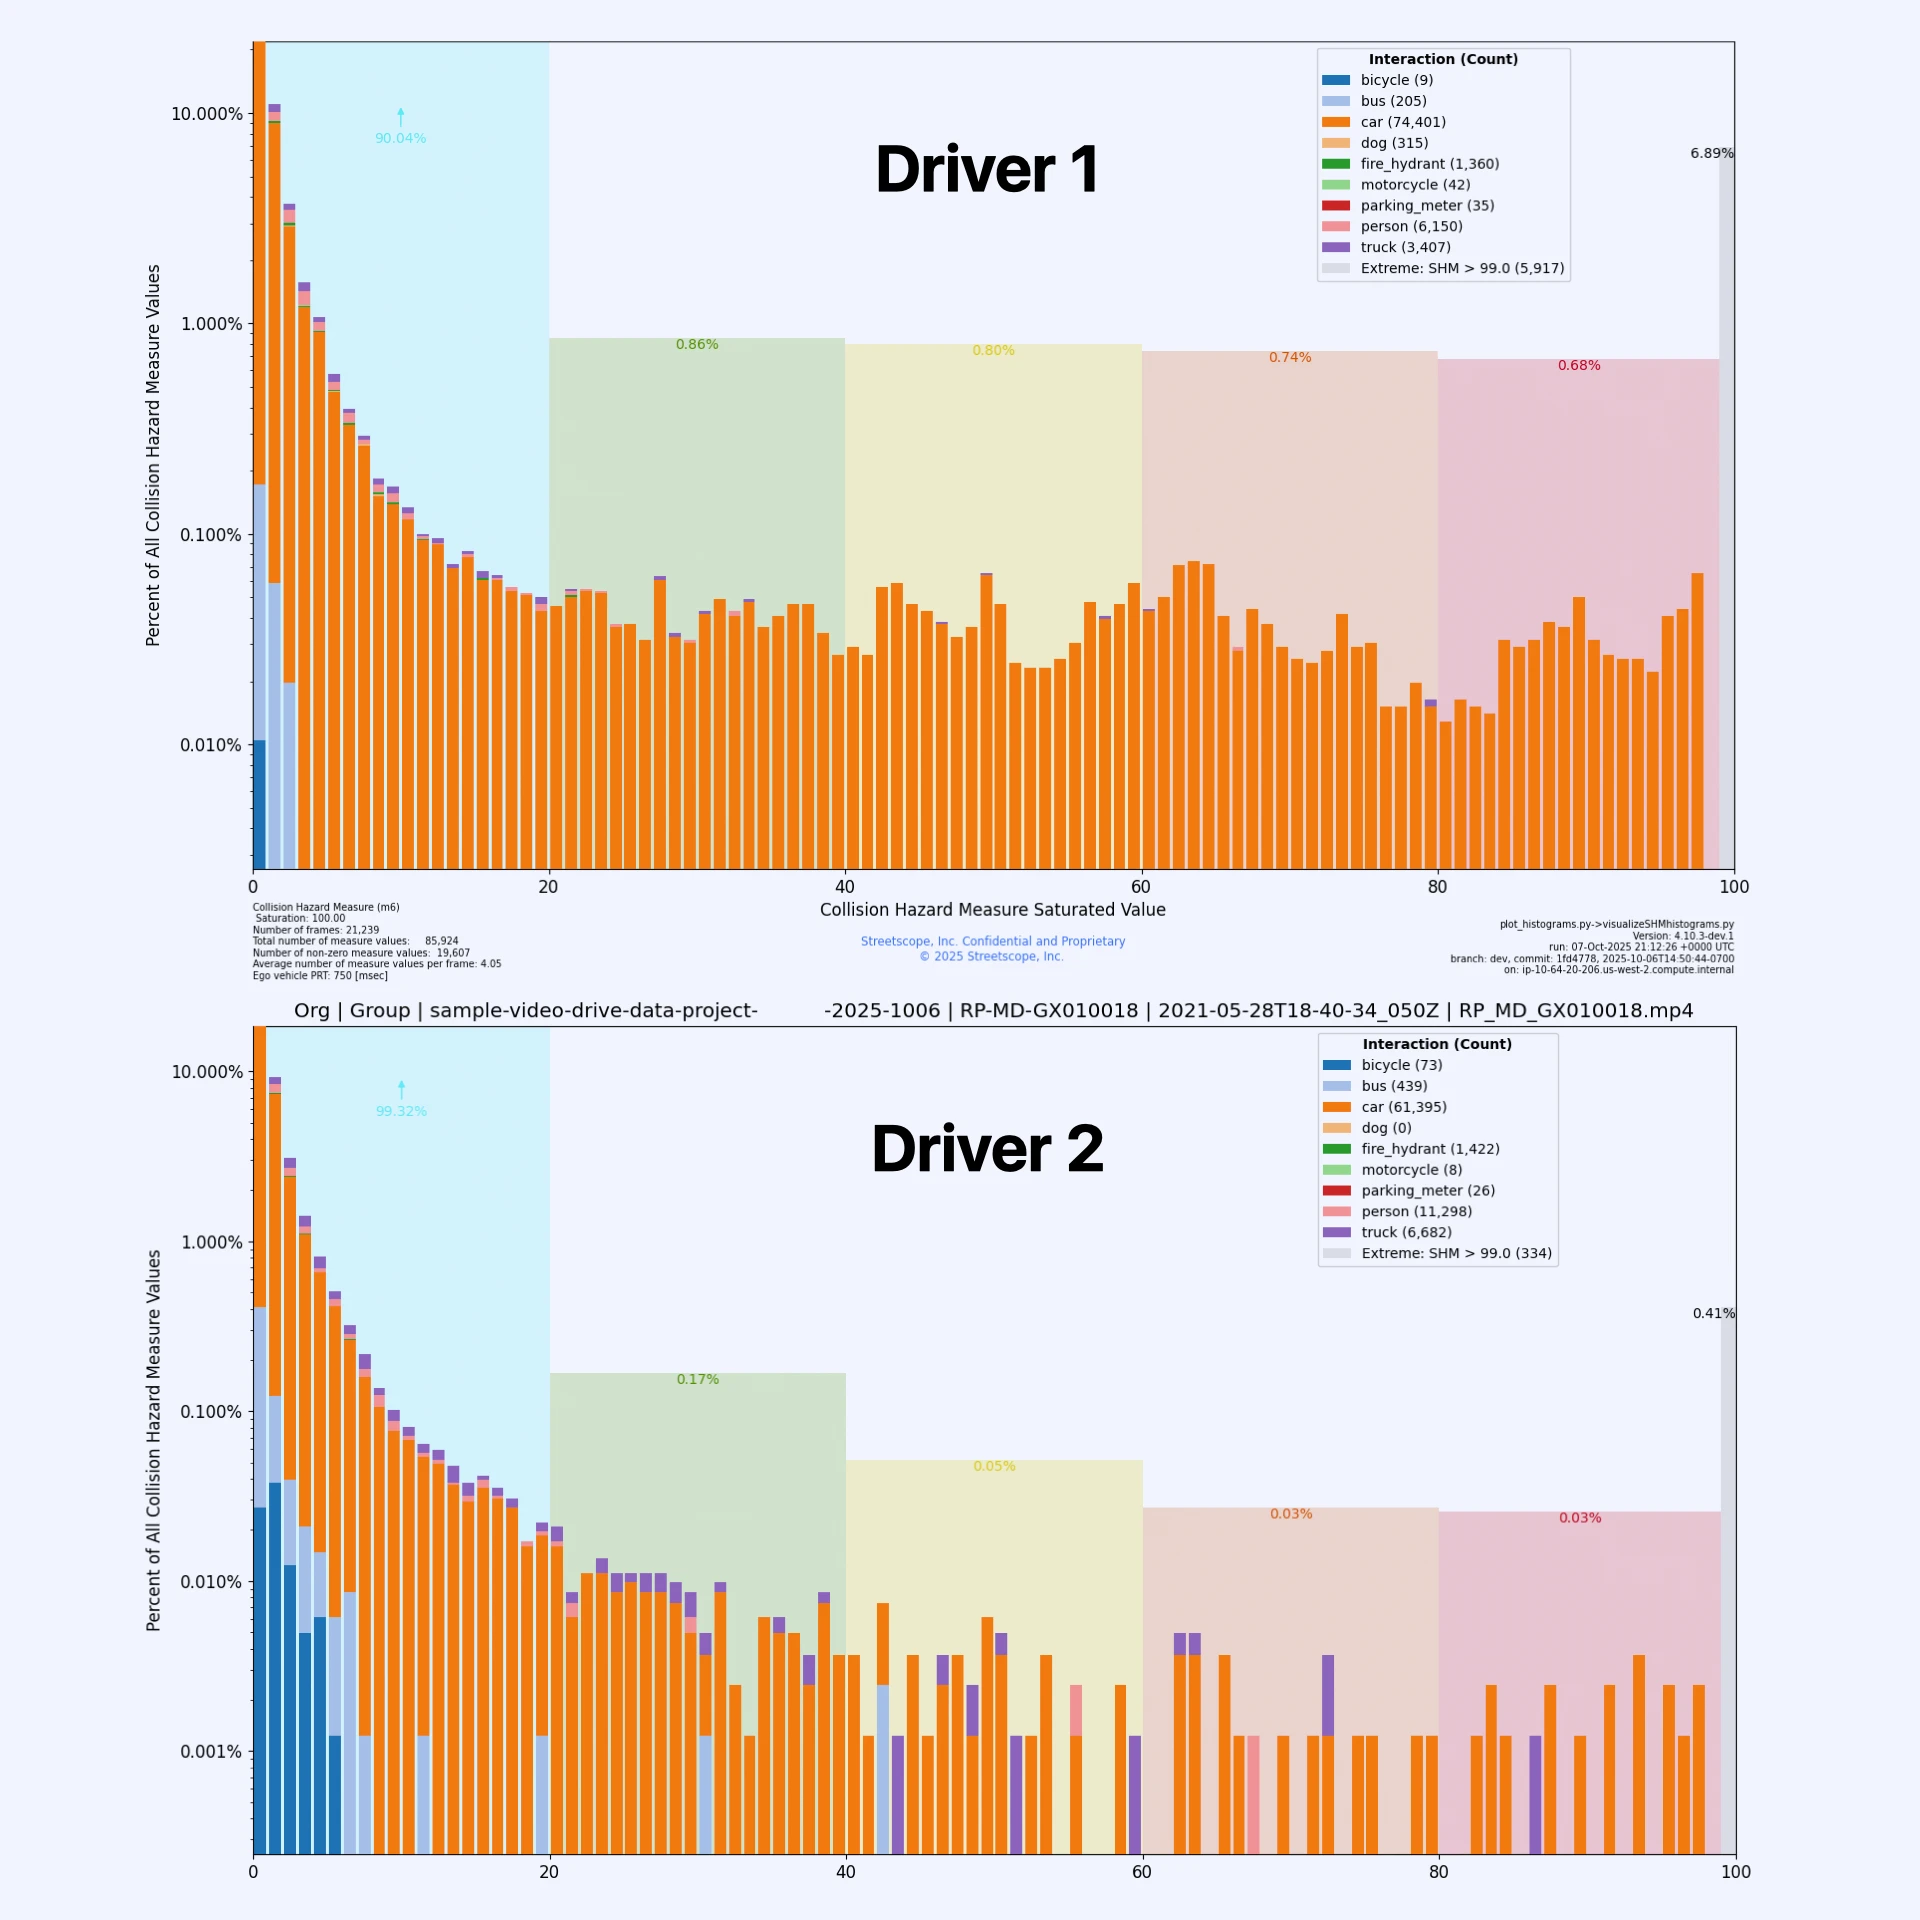
Histogram plots reveal performance differences across drivers and routes at a glance—creating a normalized 'barcode' for instant comparison.
By placing several data layers into one plot, a driver and route normalized "barcode" is created that can easily be compared across different variables.
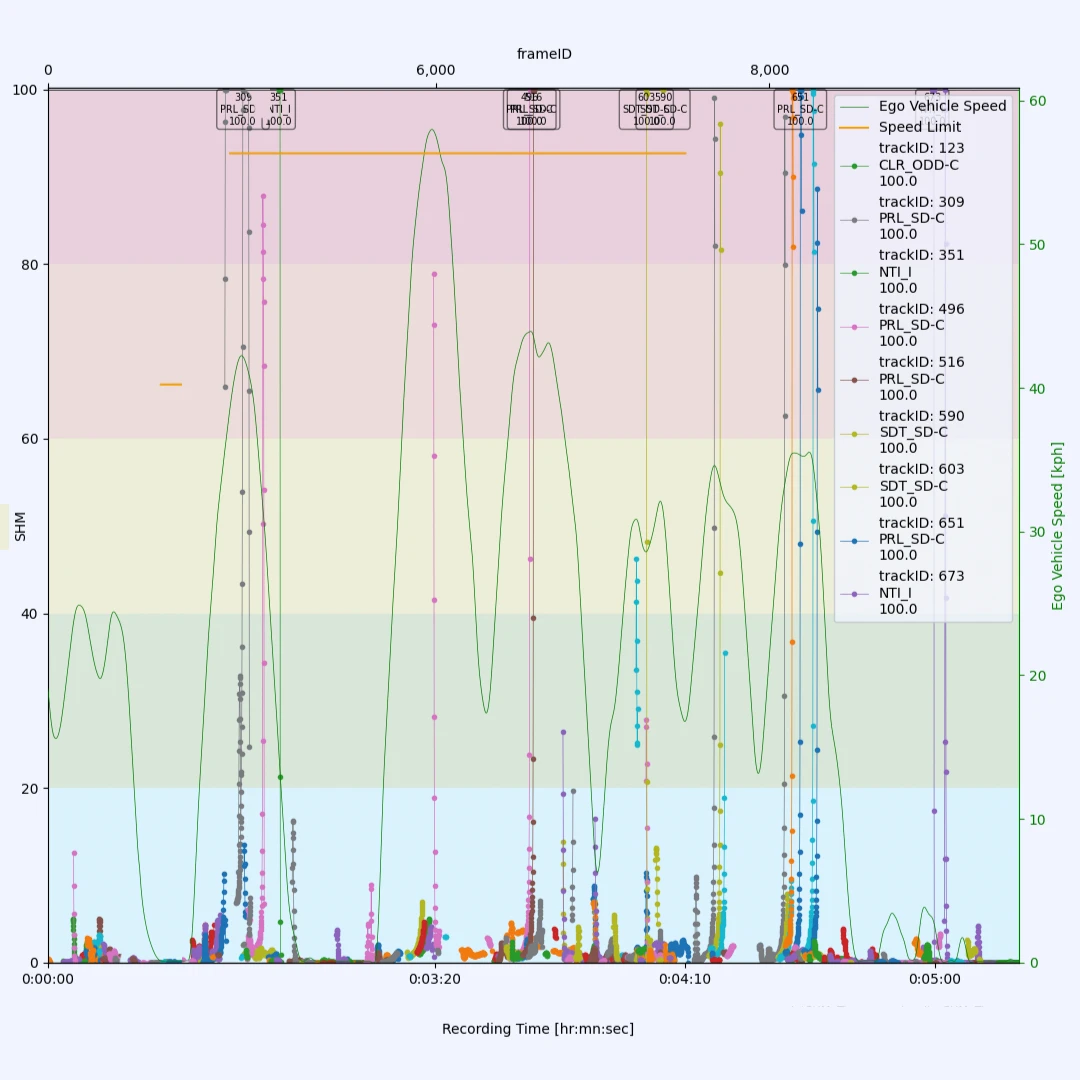
Zoom out and look at all the interactions in particular routes as they distribute over the total driving period.
Discover patterns and areas worth studying closer, and dismiss the rest, saving your team unnecessary time and effort.
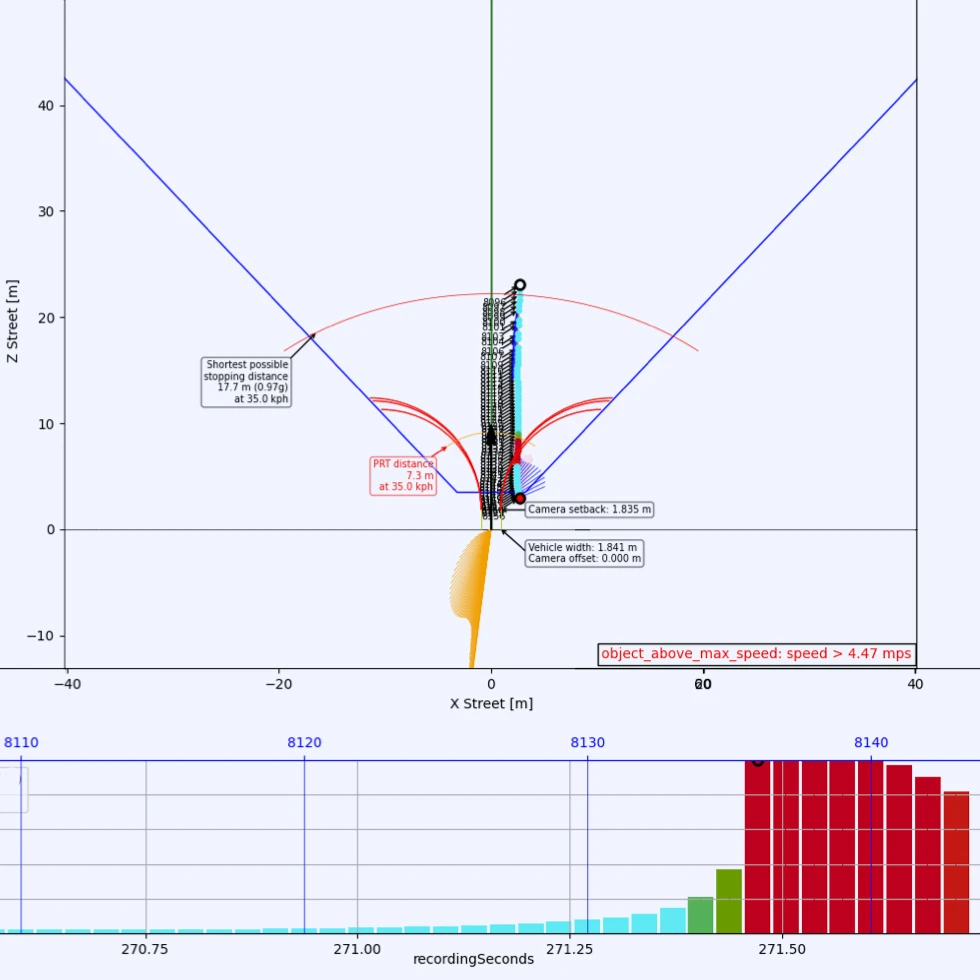
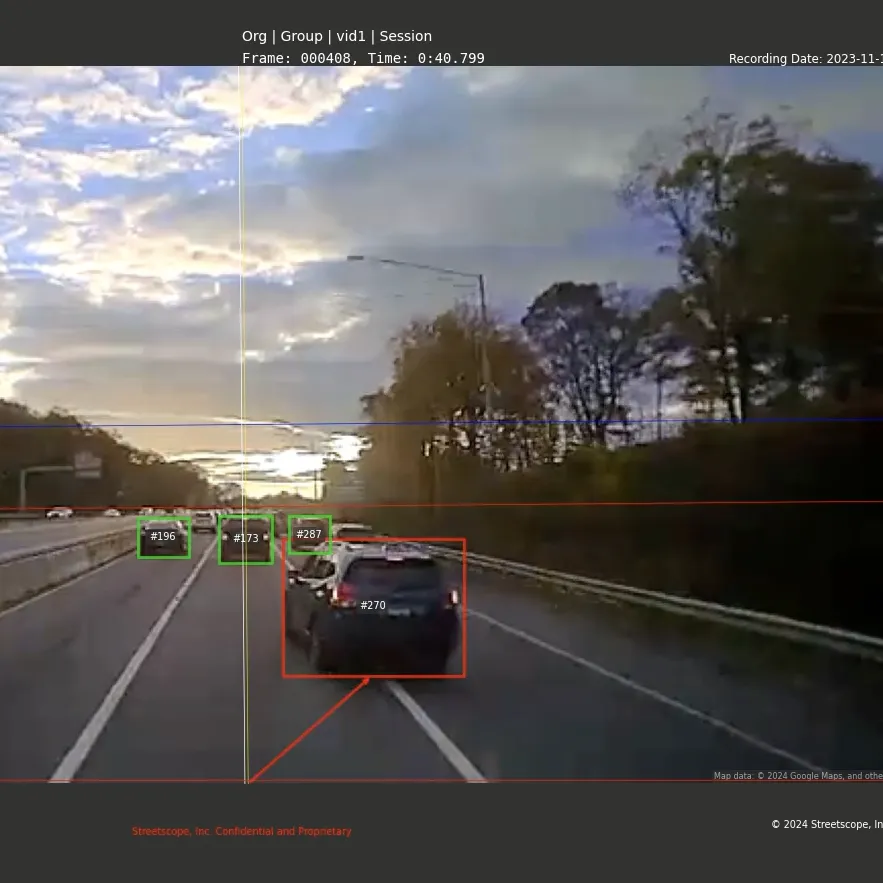
Dive deep into every interaction, discovering the trajectories of individual traffic objects as they interact with the ego vehicle.
Was the distance too small? The speed too high? How did the width of the ego vehicle affect the results?

Hotspot analysis aggregates the processed SHM™ database to identify locations with high severity and frequency of high hazard interactions.
The road network is divided into 25-meter UTM grids. TOIs with SHM™>0 are aggregated within these grids and weighted hotspot scores are calculated.
High Hazard Scenarios are segments of processed dataset identified over a customer defined SHM™ threshold to quickly visualize high hazard interactions.
Quickly identify Where to Look by identifying TOIs above a specific high SHM™ threshold value.
All our clients are unique. Measuring collision hazard using SHM™ is new, and each customer uses it to answer different questions. We integrate with your processes and needs, providing what's needed to make it valuable.

Data & other technical parameters
Data security: your cloud or ours?
User type: engineer, government, or actuary?

10-20 hours of video or object data
Show SHM's value on your own data
Decision point: proof of value achieved

On demand to long term
Integration with your systems
Turn archived/current data into gold
We support software evaluation and licensing pathways for companies, such as automated vehicle system developers, to use the SHM platform in whatever computing environment they require.
For video telematics companies (serving the commercial fleet world with move-the-needle safety services), we offer edge software integration and/or cloud analytical services.
And we partner with sector-leading consulting firms to extend the value of this universal measure of collision hazard.