We applied our collision hazard measure to data contained in one of the world’s largest open-source driving dataset. Here’s what we found — and why it matters.
This is a summary of a larger paper. To see the original, visit our Publications page.
_____________________________
There is an obvious problem with being a data company whose best evidence lives behind NDAs. We can explain the method. We can share anonymised outputs with client permission. But the question that engineers, insurers, and fleet operators actually want answered is more basic: does this measure capture something real when applied to ordinary driving? The only honest answer requires real data, in public, with the analysis open to scrutiny.
So we went looking for an open-source dataset with enough scale, richness, and contextual metadata to serve as a legitimate proving ground. We found it in Germany.
In early 2025, Yaak — a Danish AI company — released Learning to Drive (L2D), at the time the world's largest open-source self-driving dataset. Collected using 60 instrumented KIA E-Niro vehicles across 30 German cities over three years, the release contains over 5,000 hours of driving footage with GPS, IMU, and full CAN bus telemetry.
What made L2D particularly well-suited to our purposes is its ground-truth split. The dataset divides participants into two groups: expert drivers — certified driving instructors with more than 10,000 hours of teaching experience, whose driving Yaak describes as free of known errors and considered optimal — and student drivers, learner drivers with between 10 and 50 hours of experience, covering the same mandatory EU driving tasks but with documented suboptimalities. Instructors versus learners is about as clean a ground-truth signal as the real world offers.
The core question sounds deceptively simple: Do student drivers, when measured with SHM™, accumulate more collision hazard than expert drivers?
If the answer is yes, it will tells us something meaningful about SHM's sensitivity as a measurement instrument. It also has direct implications for every vertical we serve. For the AV industry in particular, it confirms that a physics-based, continuous hazard measure responds to behavioral differences that matter — the kind of differences a safety case needs to be grounded in.
But answering this question correctly turns out to be non-trivial. The two groups are not only behaviorally different. They may also have driven in different circumstances. Ignoring the differences would make any comparison meaningless.
From the large L2D corpus we identified and processed 436 usable episodes spanning 22.7 hours of driving. We ran these through the standard Streetscope pipeline, extracting frame-level and detection-level data for every traffic object visible in the ego vehicle’s camera field of view, then merging with Yaak’s sensor data. The result: approximately 823,000 frame-level rows and 1.97 million detection-level rows, down to 1.15 million after some cleaning up and filtering.
The metric we focus on in this analysis is the saturated SHM™ value per detection, the frame-level collision hazard score for each traffic object interaction, capped at 100. The distribution is heavily right-skewed: 98.3% of values fall in the 0–20 range. That is expected, as most driving involves low-level ambient hazard. The signal we are looking for lives in the tail (the moments of elevated risk) and in whether those moments occur more frequently for one group than the other.
Before reaching for statistical machinery, we looked for the obvious patterns. Raw mean SHM™ comparisons, aggregate hazard per episode, distribution shapes. The honest finding: nothing remarkable emerged from naïve comparisons. Group means were close. Distributions looked similar at first glance. Had we stopped here and reported no difference, the conclusion would have been technically accurate, but analytically wrong.
The reason is that the two groups drove under systematically different conditions. Students were concentrated on residential roads (~38% of footage) in the mid-morning; experts covered primary roads, trunk roads, and secondary roads across a full 7 AM–7 PM window including rush hour. Any comparison that ignores this is measuring road type and time of day, not driver skill.
This is where the analysis shifts from straightforward to rigorous, and it is worth explaining in some detail, because it goes to the heart of what context-aware measurement actually means at Streetscope.
Road type and hour of day are joint confounders of the expert-student comparison. They affect both which group is driving and what hazard levels look like on those roads. To isolate driver behaviour, we applied stratified bootstrap matched sampling. We divided the dataset into strata defined by every observed (road type × hour) combination, retaining only strata with at least 25 rows per group. This yielded 43 valid strata out of approximately 100 possible combinations.
Within each valid stratum, we ran 1,000 bootstrap iterations, sampling equal numbers of rows from both groups, computing the aggregate mean SHM™ for each group, and calculating the difference (Expert − Student). The procedure achieves perfect balance on road type and hour: Total Variation Distance of 0.0 in every iteration. Residual imbalances in object type and TOI interaction category were small, stable, and uncorrelated with the measured delta (r < 0.04 for both). They are not driving the result.
The bootstrap analysis produced an unambiguous finding. Across 1,000 iterations, the mean difference in SHM™ (Expert − Student) was −0.582 ± 0.075. The negative sign means that, within matched conditions, experts consistently registered lower collision hazard than students. The signal-to-noise ratio of the finding is −7.76σ, and 100% of the 1,000 iterations yielded negative delta values. Not 990 out of 1,000. Not 998. Every single one.
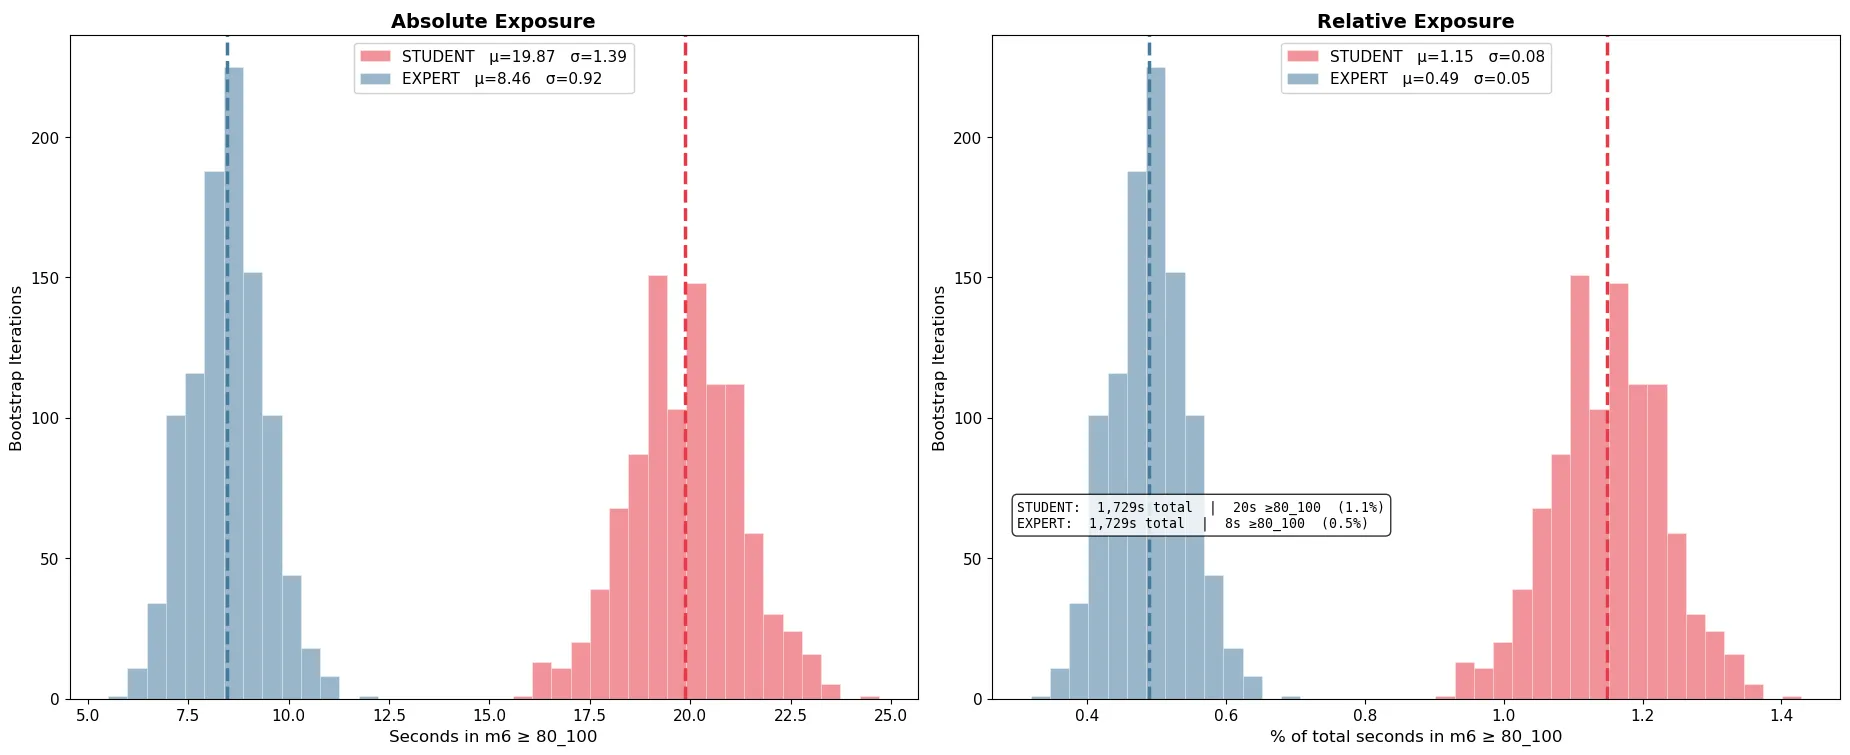
To translate this into more intuitive terms, we compute a measure we call exposure to high-risk: the proportion of detected-object interactions above an SHM™ threshold of 80. This framing captures not just the average hazard level but also the amount of time in which drivers find themselves in genuinely elevated-risk situations. And when we apply the exposure lens, we discover that, in relative terms, students spent more than twice as long in high-risk interactions as experts (1.15% vs 0.49% of driving time, a 2.35× difference), when operating in comparable road and time conditions.
To be precise about what this means: the absolute difference in mean SHM™ between the groups is small. This is a 0–100 scale where 97.2% of values are below 20, so a delta of 0.582 on the raw scale might look modest at first. But it is consistent, directional, repeatable, and robust to sampling variation. A small shift in the tail of a right-skewed distribution corresponds to meaningfully more time in high-hazard conditions, which is exactly what the 2.35x exposure figure captures.
This is not a surprising result in principle, as we would expect learner drivers to accumulate more collision hazard than professionals. What is notable is that SHM™ surfaces this difference even in matched conditions, on a modest dataset of 22.7 hours. The signal is consistent and holds up to repeated sampling. We approached this as a measurement validation, not a behavioral study — we were testing whether the instrument responds correctly to a known ground-truth difference. It does.
This study asked a pointed question: given a known difference in driver ability, does SHM™ detect it? The answer is yes. Student drivers showed 2.35 times higher exposure to high-risk traffic-object interactions than professional driving instructors. This was measured under matched road and time conditions across 1,000 bootstrap iterations, with no exceptions. The absolute effect is modest, as one would expect when comparing drivers who are both operating legally on public roads. But it is consistent, repeatable, and robust.
The student drivers in this dataset were operating in one of the most constrained and safety-conscious driving contexts described in the road safety literature: supervised practice with a professional instructor present. Research shows that learner drivers under professional supervision have among the lowest crash rates of any driver category, and that crash rates spike precisely when supervision is removed, and independent driving begins. If SHM™ detects a 135% elevated hazard exposure here, unsupervised real-world driving almost certainly shows a larger gap. The 135% figure is, if anything, a floor.
The implications cut across all four markets we serve:
Last but not least, it's worth emphasizing the small sample size needed for SHM to detect real signal. In a world awash with big data, the ability to glean insights from reasonably sized datasets is a time- and money-saver for any safety team.
We ran our SHM™ platform on data we had no hand in collecting, using a public dataset with known ground-truth labels, and the instrument responded as expected. That is what a calibrated measurement tool should do.
We’ll keep measuring.
_____________________________
Third-party data attribution. The Learning to Drive (L2D) dataset is the work of Yaak A/S and is made available under the Apache License, Version 2.0. The dataset was accessed via Hugging Face in March 2026 and used without modification to the source files. Streetscope's outputs are derived works produced by Streetscope's proprietary platform operating on L2D inputs and are not attributable to Yaak or Hugging Face.
No affiliation. Streetscope is not affiliated with Yaak, Yaak A/S, or Hugging Face, Inc. The Yaak Learning to Drive (L2D) dataset was obtained independently through Hugging Face and processed solely by Streetscope. References to Yaak and Hugging Face are for attribution purposes only. Neither organisation has reviewed, endorsed, or contributed to this analysis.
Use of AI tools. Data collection, wrangling, analysis, Python scripting, and drafting were supported by AI tools including Perplexity and Claude. The author directed the use of AI tools and reviewed, edited, and approved all outputs, taking full responsibility for any errors or omissions.
All data available for review upon request.
\\\
Original photo by Markus Spiske on Unsplash